Here Are the States With the Most Fast Food Restaurants Per Capita

This may come as a shock, but Americans love fast food. We love it so much that certain chains are opening palatial flagship locations with rooftop decks in major cities, and regularly unleashing new and borderline insane menu items to get us to swing by and eat more of it. We love it so much, that one in four adults in America actually eats at a fast food joint every single day. Seriously.
But besides interstate rest stops and mall food courts, where are you most likely to find the most Wendy's, Taco Bells, and Burger Kings around the country? Well, the data whizzes at Datafiniti went the extra mile and figured out of the roughly 500,000 fast food joints sprinkled across America, which states are home to the most per capita.
Spoiler alert: the South and Midwest are great places to be if you're jonesing for a quick drive-thru-accessible pick-me up.
By consulting its extensive database of business data on fast food restaurants and their geographic locations, Datafiniti was able to determine which areas -- and, more specifically, which states -- have the highest concentration. It turns out Alabama boasts the most, with 6.3 per person, while Nebraska and West Virginia earn the number two and three spots, with 5.4 and 5.3 locations per person, respectively.
If you want to know where your state landed in the ranking, check out the full list (shown below).
51. Vermont: 1.9 per capita
50. New Jersey: 2.0 per capita
49. New York: 2.1 per capita
48. Mississippi: 2.1 per capita
47. Connecticut: 2.4 per capita
46. Rhode Island: 2.5 per capita
45. Alaska: 2.6 per capita
44. Massachusetts: 3.1 per capita
43. Maine: 3.1 per capita
42. Washington: 3.1 per capita
41. Hawaii: 3.2 per capita
40. Pennsylvania: 3.2 per capita
39. New Hampshire: 3.2 per capita
38. Florida: 3.3 per capita
37. California: 3.6 per capita
36. Oregon: 3.6 per capita
35. Utah: 3.6 per capita
34. North Dakota: 3.6 per capita
33. Minnesota: 3.7 per capita
32. Montana: 3.8 per capita
31. Idaho: 3.8 per capita
30. Maryland: 3.9 per capita
29. Wisconsin: 4.0 per capita
28. Michigan: 4.0 per capita
27. Colorado: 4.0 per capita
26. Wyoming: 4.1 per capita
25. Delaware: 4.1 per capita
24. Virginia: 4.3 per capita
23. South Dakota: 4.3 per capita
22. New Mexico: 4.3 per capita
21. Texas: 4.3 per capita
20. Louisiana: 4.4 per capita
19. Illinois: 4.5 per capita
18. North Carolina: 4.5 per capita
17. Arizona: 4.6 per capita
16. Iowa: 4.7 per capita
15. Kansas: 4.7 per capita
14. Arkansas: 4.7 per capita
13. Ohio: 4.7 per capita
12. Nevada: 4.7 per capita
11. Kentucky: 4.8 per capita
10. South Carolina: 4.9 per capita
9. Missouri: 4.9 per capita
8. Georgia: 4.9 per capita
7. Washington, DC: 5.0 per capita
6. Indiana: 5.0 per capita
5. Tennessee: 5.2 per capita
4. Oklahoma: 5.3 per capita
3. West Virginia: 5.3 per capita
2. Nebraska: 5.4 per capita
1. Alabama 6.3 per capita
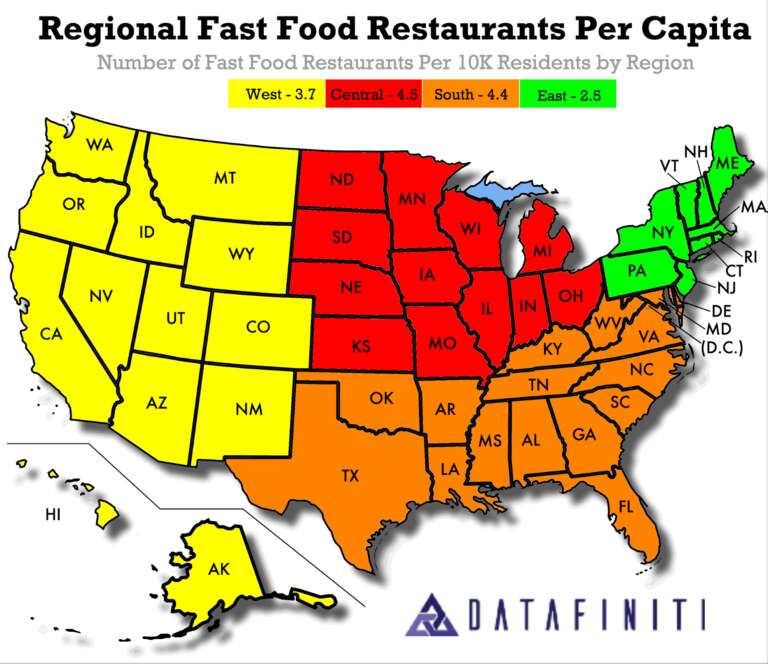
As for how density breaks down by regions of the country, the Central US is home to the most per 10,000 people (4.5), while the South ranks number two with 4.4 joints per 10,000. Then, it's the West and East coasts taking in third and fourth, with 3.7 and 2.5 fast food establishments per as many folks.
Datafiniti also looked at which restaurants have the most locations nationally. Subway sits in the number one spot, followed by McDonald's at number two and Burger King at number three. Meanwhile Taco Bell and Pizza Hut earn the number four and five spots, respectively. Interestingly, Chick-fil-A, which is reportedly on track to become the third largest chain in the country, currently sits in the No. 15 spot.
Just some more intel to consider next time you're thinking about making a big move.
h/tThe Takeout
Sign up here for our daily Thrillist email and subscribe here for our YouTube channel to get your fix of the best in food/drink/fun.